Release GeoDa 1.8 beta - an open source software for spatial data analysis
GeoDa is a free and open source software tool for spatial data analysis. The latest beta version 1.8 contains several new features such as support for more spatial file formats, full space-time data support in all views, basemap layers for all maps, averages charts, scatter plot matrices, nonparametric spatial autocorrelation (correlogram), and flexible data categorization.
For details: http://geodacenter.github.io/
For an official release, follow us on twitter: @GeoDaCenter
Here are some previews.
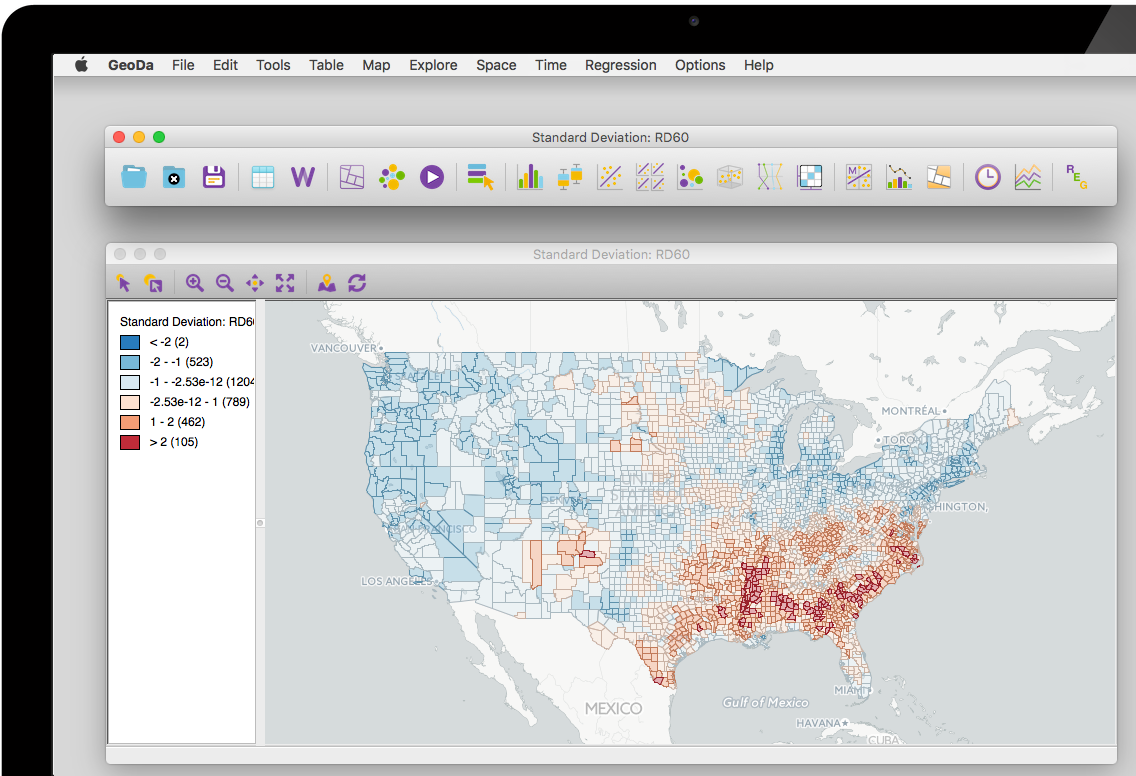
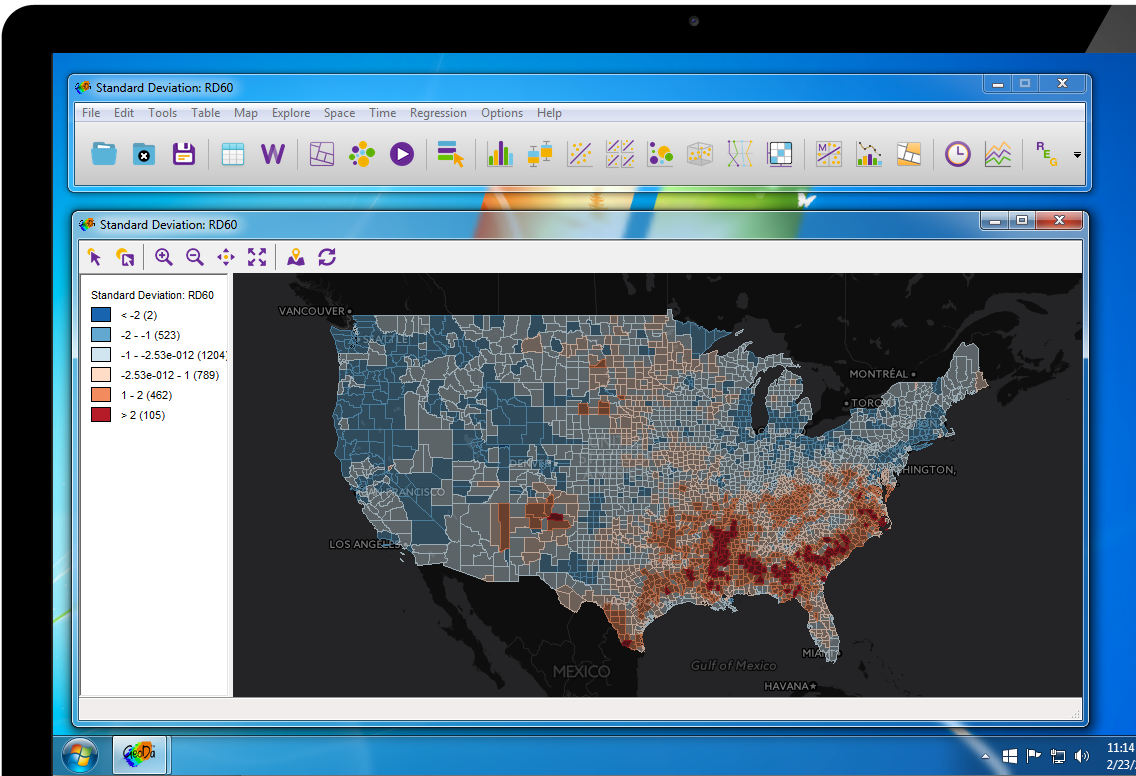
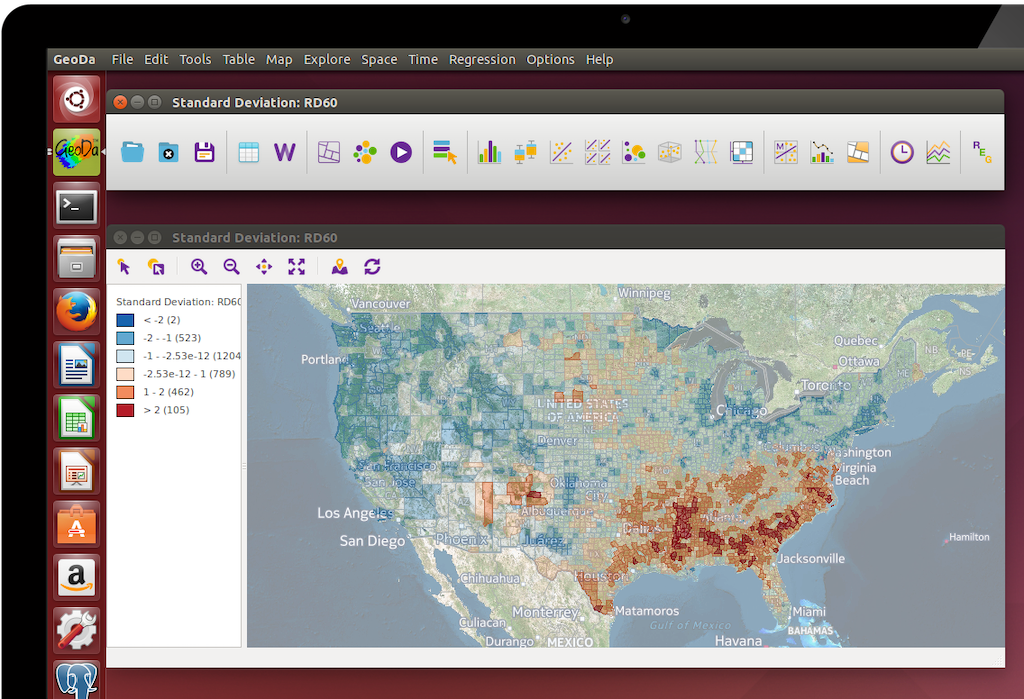
Cross Platform
GeoDa runs on Mac OSX, Windows and Linux
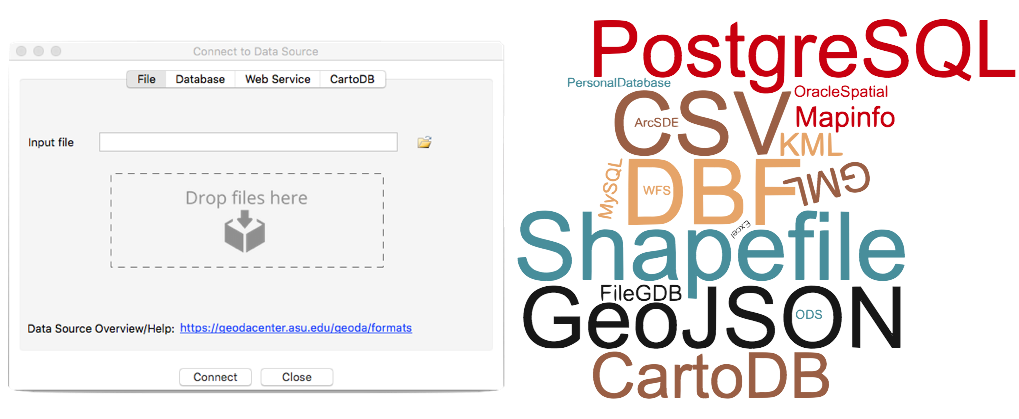
GeoDa Now Supports More Spatial Data Formats
GeoDa now supports a larger variety of vector data in different formats: You can work with shapefiles, geodatabases, GeoJSON, MapInfo, GML, KML, and other vector data formats supported by the GDAL library. The program also converts coordinates in table format (.csv, .dbf, .xls, .ods) to one of these spatial data formats and converts data between different file formats (such as .csv to .dbf or shapefile to GeoJSON). Selecting a subset and exporting it as a new file is now also possible.
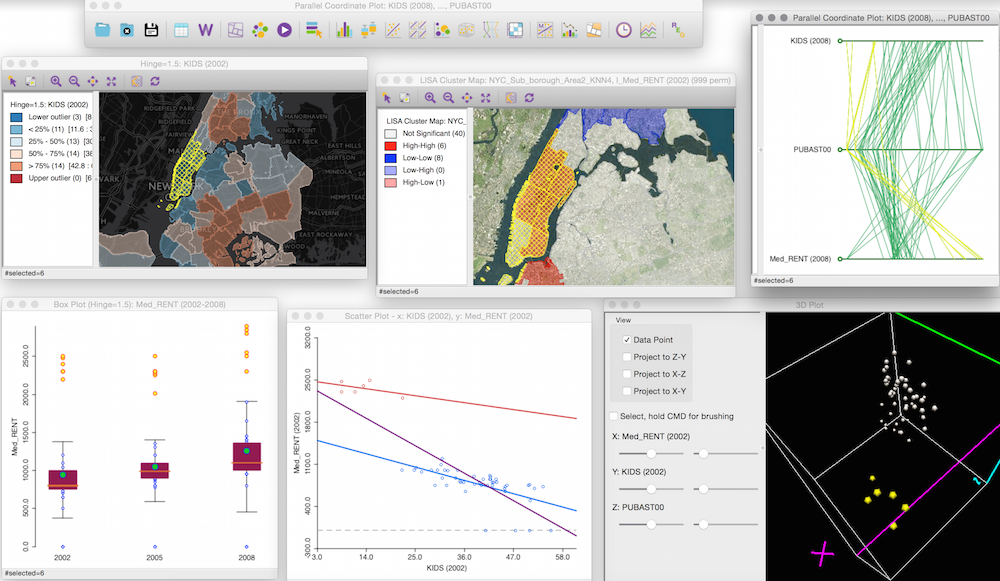
Explore Statistical Results through Linked Maps and Charts
In contrast to programs that visualize raw data in maps, GeoDa focuses on exploring the results of statistical tests and models through linked maps and charts.
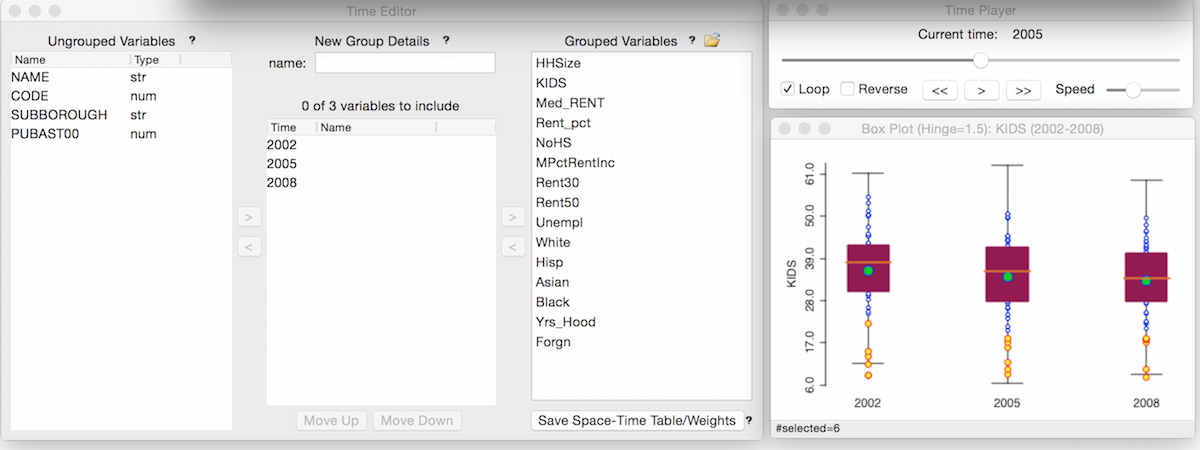
Analyze Spatial and Temporal Patterns Across Linked Views
You can now group the same variable across time periods in the new Time Editor to explore statistical patterns across space and time. Then explore results as views change over time with the Time Player.
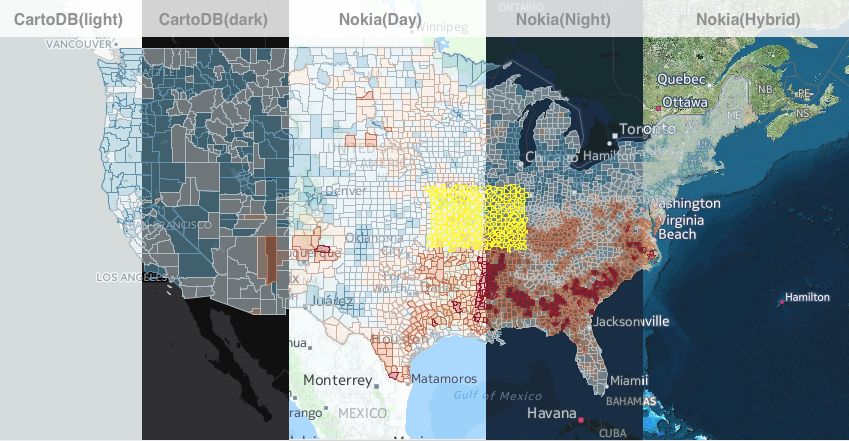
Ground-Truth Map Results with Basemaps
If your spatial data are projected (.prj file), you can now add a basemap to any map view, including cluster maps, for better orientation and for ground-truthing results.
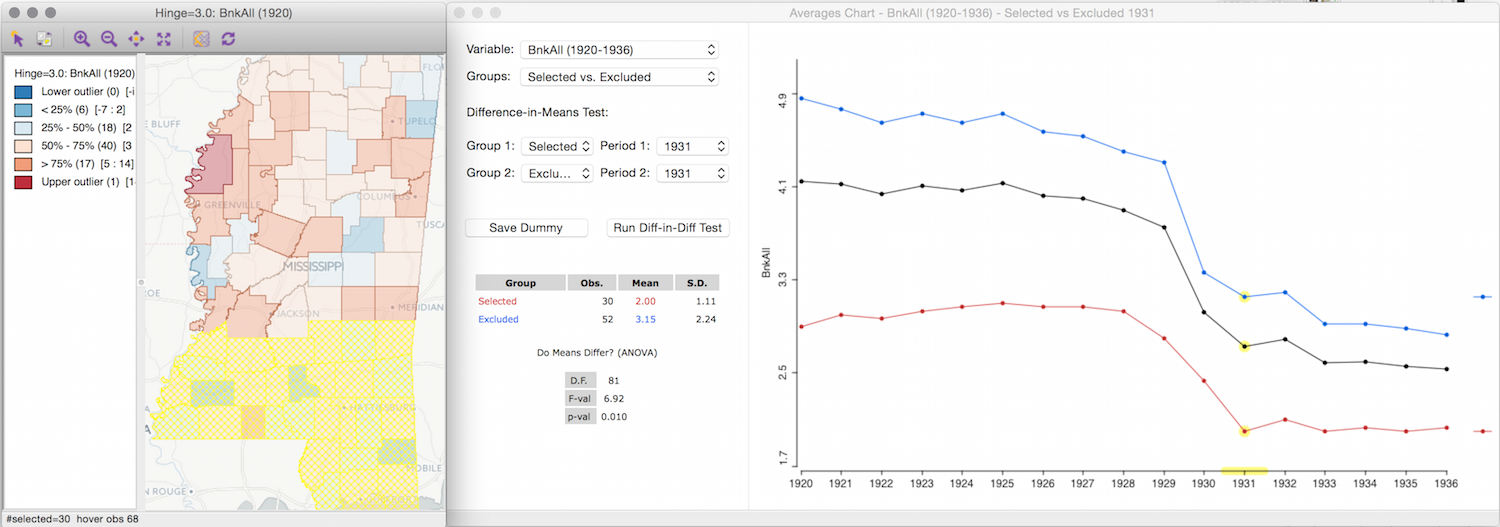
Compare Averages Across Time and Space
A new Averages Chart compares values that are averaged over time and/or space and tests if the differences in these means are significant. For instance, first select if you want to compare means of selected vs. unselected observations in the same time period or compare all observations for different time periods. A basic pre-post/impact-control test then indicates if your results changed over time and space (using an F-test and difference-in-difference test).
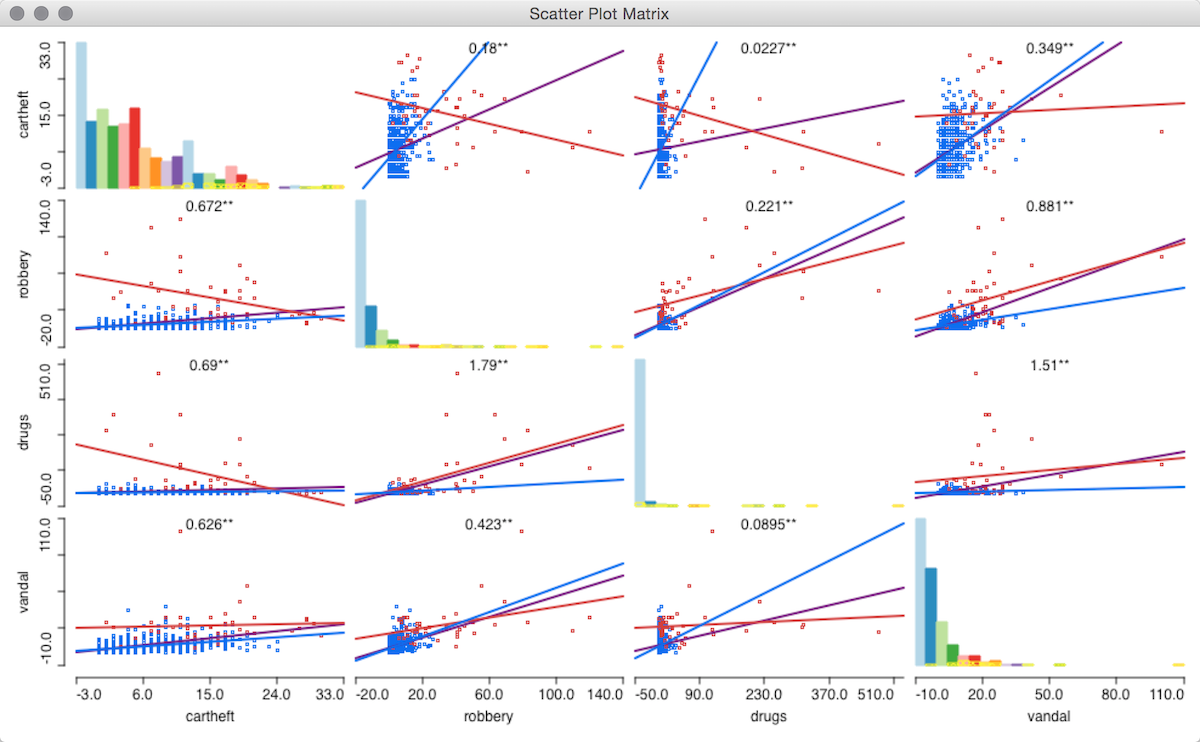
Detect Relationships in Multivariate Space
A scatter plot matrix allows you to explore multiple bivariate correlations at once. In this example, the regression slopes for selected, unselected and all police precincts in San Francisco are shown to explore relationships between four types of crime.
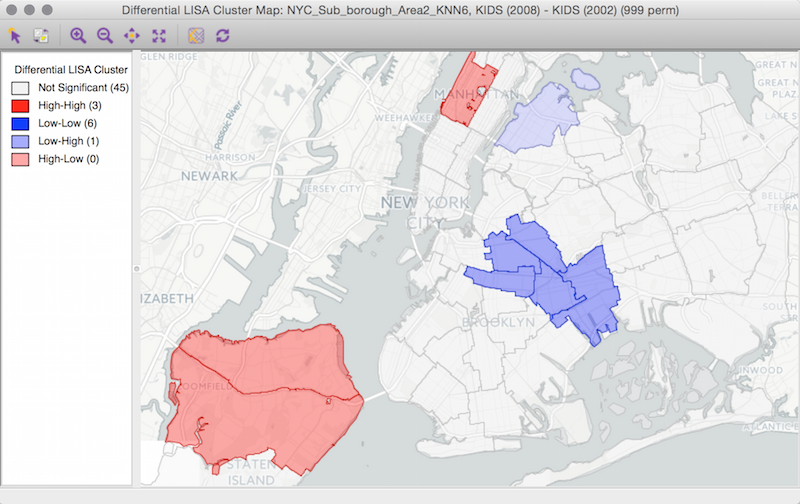
Determine if Changes Over Time Are Spatially Clustered
Use a global or local Differential Moran?s I test to find out if a variable?s change over time in a given location is statistically related to that of its neighbors. For instance, this local (LISA) cluster map shows hotspots in New York with larger changes in the share of kids between 2002 and 2008 (and coldspots with smaller changes).
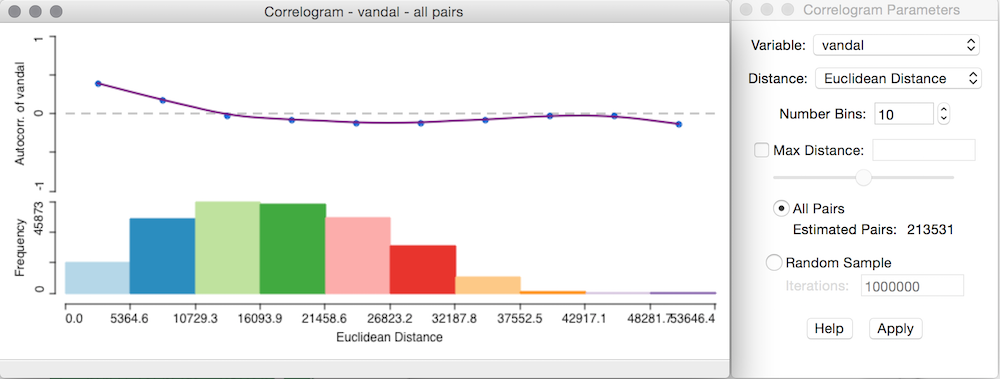
Find the Threshold Where Spatial Correlation Ends
A nonparametric spatial autocorrelation test (correlogram) is now available to determine distance thresholds when the values of neighboring pairs are no longer correlated.
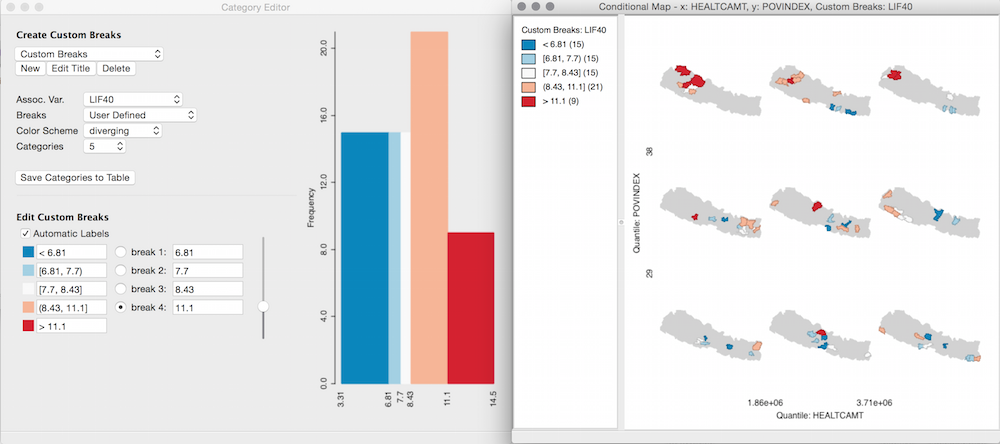
Explore the Impact of Flexible Data Categorization
With the new category editor, you can explore how sensitive your results are to changes in the thresholds that categorize your data. In this example the thresholds in the conditional map (right) are based on the categories that can be adjusted in the category editor (left).